Without a doubt, the ears are the most important tool for any work with sound; however, they are inherently subjective and can be easily tricked by the environment and various auditory illusions. Thus, it is useful for us to complement them with tools capable of providing definitive answers to specific sound-related queries. Identifying the precise frequency of a sound, its timbral makeup, measuring how loud it is, peeking into its spatial properties, diagnosing concrete problems such as noise or distortion—these are some of the things that audio analysis tools are indispensable for.
While many of our readers are likely familiar with many audio analysis tools, getting into them can be somewhat challenging. When should you use a specific tool? Which settings are best for a specific situation? Finally, how do you interpret the visuals that you see? All of these are valid questions, and having a clearer understanding of various types of audio analysis tools can be incredibly beneficial for anyone dealing with sound on a regular basis.
So if any of these questions ever enter into your stream of thoughts, this article is for you. Even if you are an experienced sonic realm dweller who has not developed a habit of "looking" at sounds, this article may be a compelling argument for why it may be beneficial to you. We will delve into the expansive toolkit for sound analysis, highlighting major instruments and explaining their applications. Focusing primarily on tools applicable in the contexts of sound synthesis, sound design, and music production, we'll guide you through all of the core information you need to know to use them. Providing examples of both hardware and software solutions, we aim to equip you with a comprehensive understanding of these invaluable aids in your sound work.
Before We Begin
Writing about audio analysis tools presents an uncommon challenge for someone who writes about musical instruments and music technology on a regular basis. Synthesizers, drum machines, effects pedal—all of these things are fun to use, and easy to get passionate about. These devices are made to enhance our creativity and inspire us. It wouldn't even be an exaggeration to state that, with musical instruments, we tend to develop very personal relationships.
But audio analysis…well, that has that scientific and engineering ring to it, and not without a reason. Oscilloscopes, meters, and spectrographs are utilitarian tools for measuring and visualizing sound. Thus, discussing them can quickly get quite dry and technical. Moreover, it doesn't help that the nomenclature associated with different devices at times may seem convoluted. That said, audio analysis is indispensable for working with audio, and thus understanding these tools is crucial for making skillful decisions in your work. Thus even if it gets a bit technical, the benefits abound.
The goal of this article is to demystify the aforementioned instruments, their features, and properties as much as possible while keeping our discussion casual and (hopefully) entertaining. It helps that the visual data presented by some of these devices is often rather mesmerizing, and dare I say intuitive once you know what you are looking at. Some of these tools do have, although quirky, interesting creative side-applications, and I will talk about these aspects too where applicable.
It is also important to keep in mind that, unlike other kinds of data visualization, with sound analysis instruments you'll need to develop a mental relationship between what you see and what you hear. If you don't have much experience working with audio analysis instruments, it may take a little getting used to, but as I've said, it will quickly become intuitive.
The Basics
Any given sound wave has several characteristics (including familiar characteristics like volume, frequency, timbre, stereo-width, and so on). Some audio analysis tools, like level meters, are designed to measure just one of these properties. Others, like oscilloscopes and spectrograms, offer a more comprehensive picture. The applicability of these tools, while often overlapping, varies with the type of work one is doing with sound. For instance, oscilloscopes are immensely useful in sound synthesis when one needs to closely examine a waveform to understand how parameter tweaks affect timbral changes. However, in live sound engineering, tools like level meters are more commonly used.
But before we get into discussing these tools individually, let’s revisit the parameters of a sound that they are measuring and visualizing. First, there is amplitude, which corresponds to the intensity or loudness of a sound, and is measured in decibels (dB). The second crucial parameter of any sound is its frequency–an absolute measure of sound’s vibration rate, related to pitch, and expressed in Hertz (number of cycles per second). Third is the more elusive concept of timbre, which corresponds to the harmonic makeup of a sound that defines its unique character. Lastly, there is phase, which relates to the exact point in a waveform cycle, measured in degrees.
Having established the foundational parameters of sound, let's begin to unravel the toolbox.
Level Meters
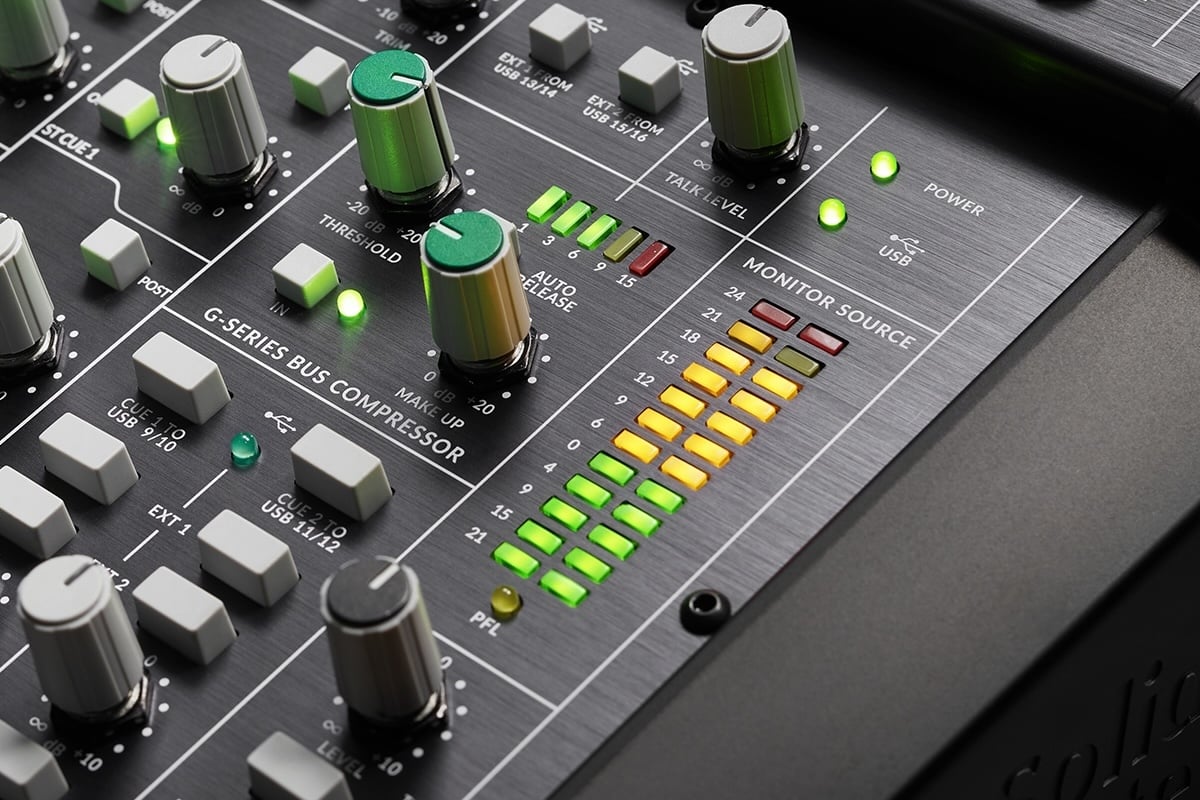
Level meters are perhaps the most straightforward and ubiquitous of the bunch, displaying the loudness or intensity of sound. They can come in standalone form, or can be embedded in the architecture of other pieces of equipment, ranging from mixing boards and consoles to dynamics processors, equalizers, and other audio modifiers. It's also not uncommon for a piece of equipment to have two or multiple level meters—one for each channel of audio, an input-output pair, or offering different representations of loudness.
Let’s delve deeper into that last point. Sound loudness is a perceptual attribute, meaning that it's subjective and based on individual interpretation. While one sound might be perceived as loud to one person, another might find it moderate or quiet. This relativity is influenced by factors such as the listener's hearing abilities, the context in which the sound is presented (a whisper can seem loud in a silent room), and the listener's previous exposure to other sounds (a quiet melody can seem loud after a softer one). As such, what is "loud" in one context or to one person might not be the same in another.
As you can guess, measuring something so subjective can be tricky, and thus different level meters are suited for different occasions.
So before we proceed to talk about different types of level meters, let's address the variance across the reference points in loudness measuring. Both dBu and dBV measure voltage level, but in different environments. The former is primarily used in the realm of pro-audio equipment, with 0 dBu being approximately equal to 0.775V. The dBV is largely employed in the world of consumer electronics, where 0 dBV is equal to 1V. Yet another reference is used by computers and digital systems, dBFS (Decibel Full Scale), where 0 dBFS represents the maximum loudness the system can handle before distorting. Lastly, there is the dBSPL (Decibel Sound Pressure Level) which measures the acoustic pressure of a sound wave, with 0 dBSPL signifying the quietest sound humans are capable of hearing. While there are a few other dB references, these are the most commonly encountered across audio equipment. Now that you know various level meters may express loudness based on different references, it's time to familiarize ourselves with the tools.
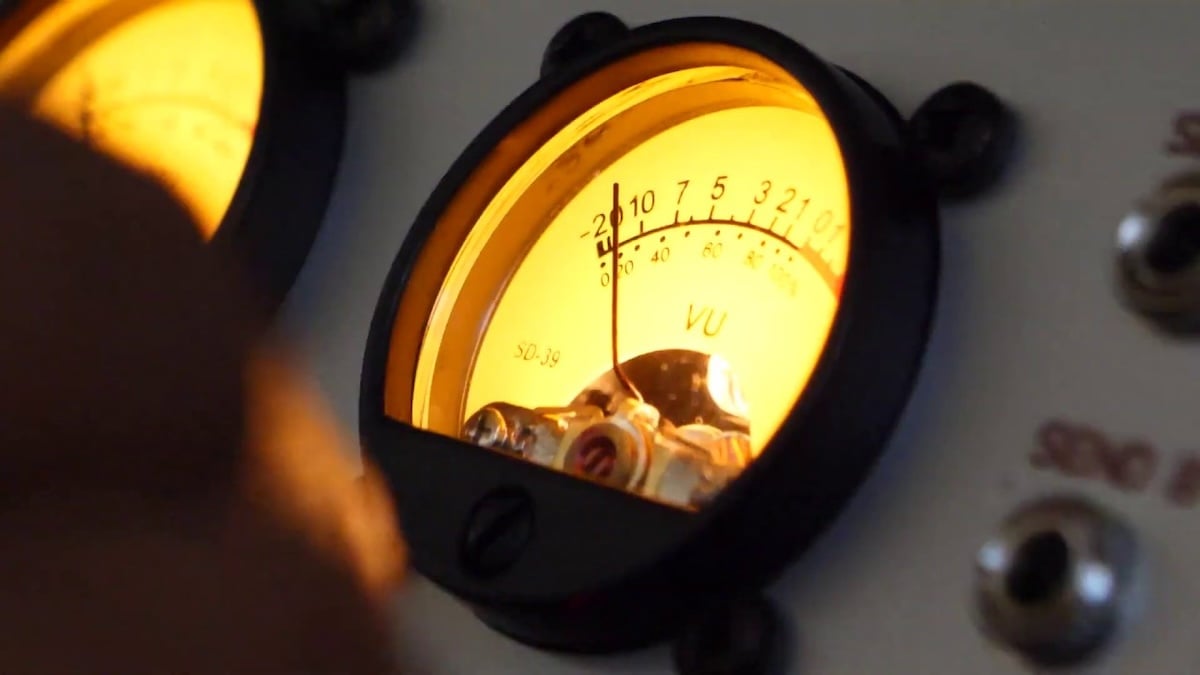
[Above: VU meters on the Audio Gear Obsession SUMMINGFACILITY, a mixer for Eurorack modular synthesizers.]
Firstly, level meters can be divided into two categories: analog and digital. In 1939, a joint effort between Bell Labs, CBS, and NBC developed the VU Meter or Volume Unit Meter, which quickly began to appear on professional broadcast and recording equipment. Widely recognizable by its rectangular display, often backlit, and a mechanical needle bouncing between values on a scale, the VU meter is the only level meter that strictly exists in the analog domain. The scale typically runs from -20 to +4 VU, with 0 VU being equivalent to +4 dBu. VU meters measure the average or perceived loudness of the audio signal, and they don't catch any fast transient peaks. Thus, they are best suited for headroom monitoring and ensuring that the signal doesn't consistently clip or overload.
For faster transient response, we rely on Peak Program Meters (PPMs). These types of meters come in both analog and digital formats and are best suited for measuring the peak amplitude of the signal. That said, there are differences between analog and digital PPMs, especially concerning accuracy, speed of peak measurement, and importantly, reference level. While a 0 dB mark on an analog peak meter leaves some overhead for the signal, 0dBFS on digital systems is a hard line that should not be crossed.
In some high-precision situations, for example during the mastering process, more advanced peak measurement may be required, and that's where True Peak Meters come in. Through the process of oversampling, TPMs check the level of audio between the samples, providing an even more accurate representation of the sound's maximum loudness.
RMS meters, similarly to VU meters, provide an indication of the average power or perceived loudness of an audio signal over time. However, they are not exactly the same as VU meters, as RMS is based on precise mathematical averaging, while VU's response is determined by the ballistics of the needle. Moreover, RMS meters are available in both analog and digital formats.
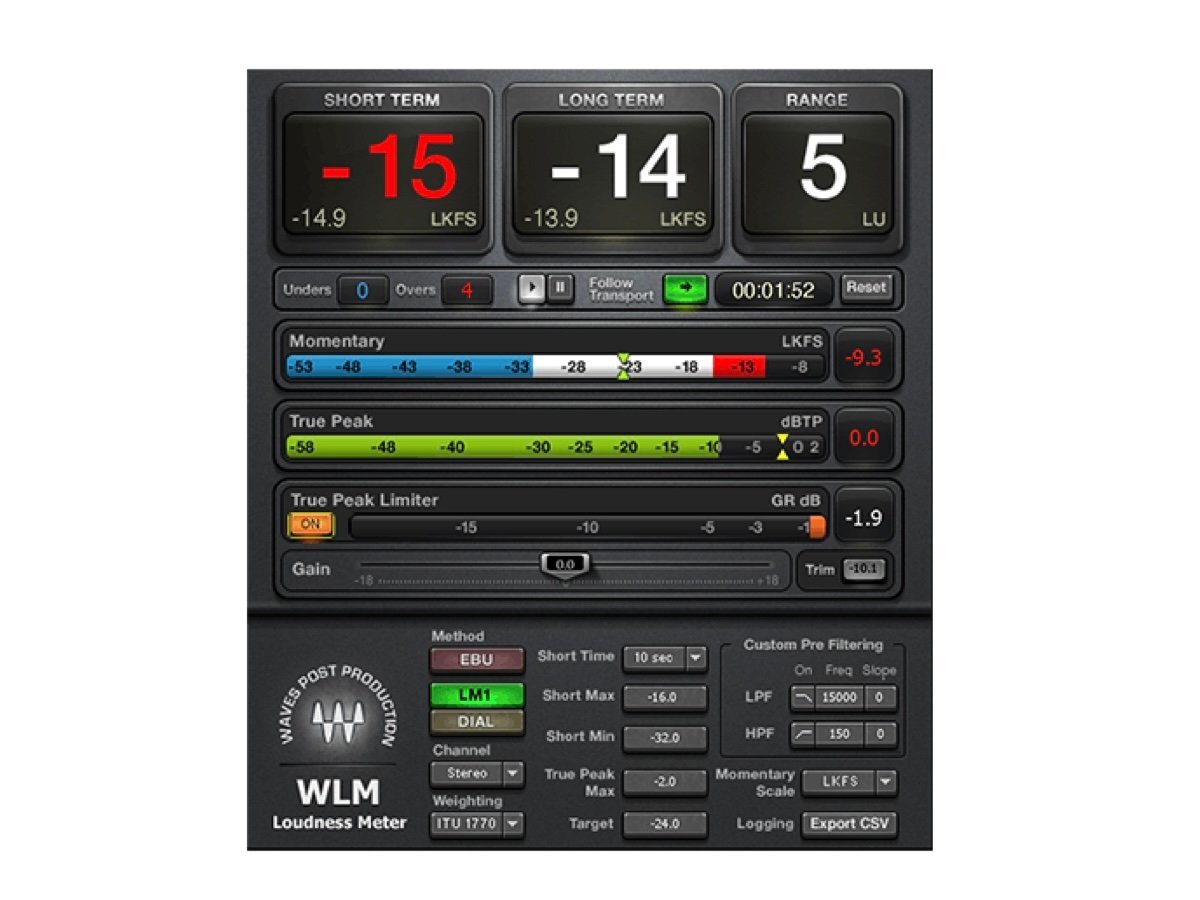
[Above: the Waves Loudness Meter plugin, complete with LUFS readouts.]
Then there are LUFS Meters (Loudness Units Relative To Full Scale)—a modern loudness standard based on a complex algorithm that considers multiple aspects of human auditory perception. Due to the complexity of real-time calculations, LUFS meters are digital and can be found across professional audio equipment and software applications.
Lastly, though not encountered as often, there are the Dynamic Range Meters, which measure the difference between the loudest (peak or RMS) and quietest parts (noise floor) of an audio signal, offering a simplified representation of the overall dynamic range of the sound.
With this information, you should understand the type of level meter in front of you and what it tells you about the dynamics of the audio signal. Furthermore, this should guide you in deciding which type of level meter you need for a specific task.
Oscilloscopes
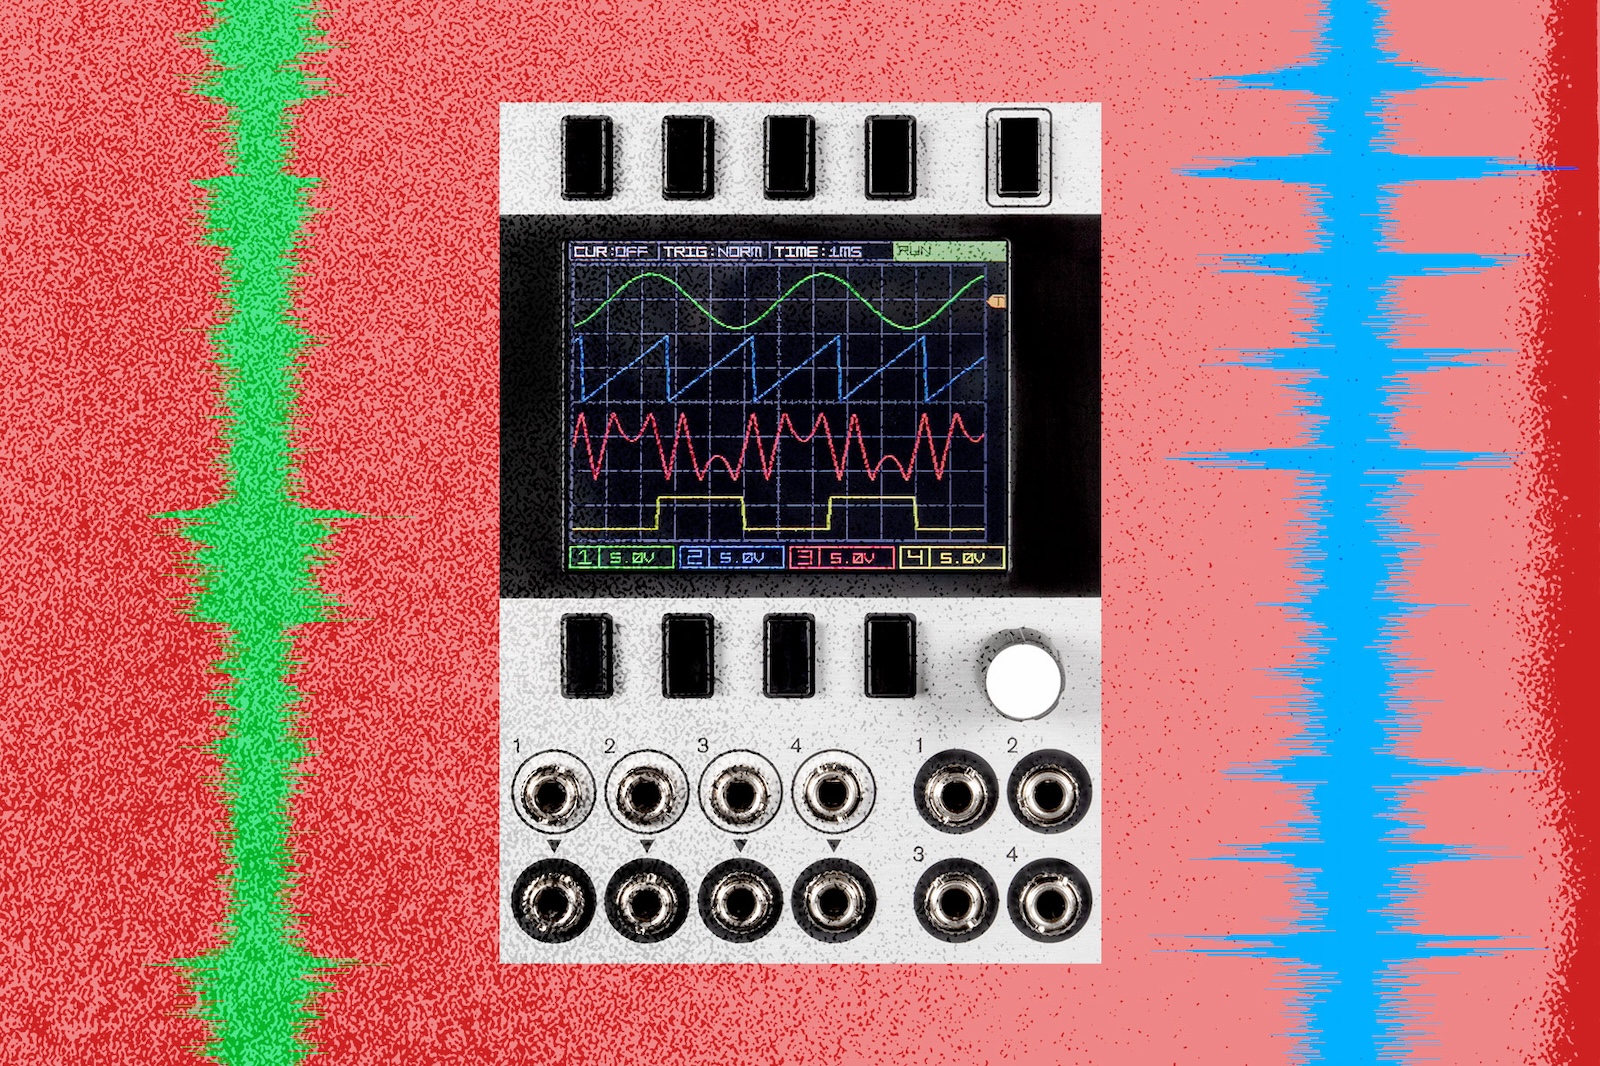
An oscilloscope is a device primarily used for the time-domain representation of signals. This instrument visualizes how the voltage or amplitude of a signal varies over time. The pattern displayed on a two-dimensional screen is known as a "trace" or "waveform", offering insight into the nature of the signal. The vertical axis represents the amplitude or voltage, while the horizontal axis indicates time. Both axes are adjustable to display various signal types. Importantly, while oscilloscopes are valuable for visualizing audio signals, they are versatile tools used across many fields of science and engineering. Their wide range enables representation of signals from the infrasonic to ultra- and hypersonic ranges. This versatility makes oscilloscopes especially useful in sound synthesis, where they can illustrate both audio and modulation signals.
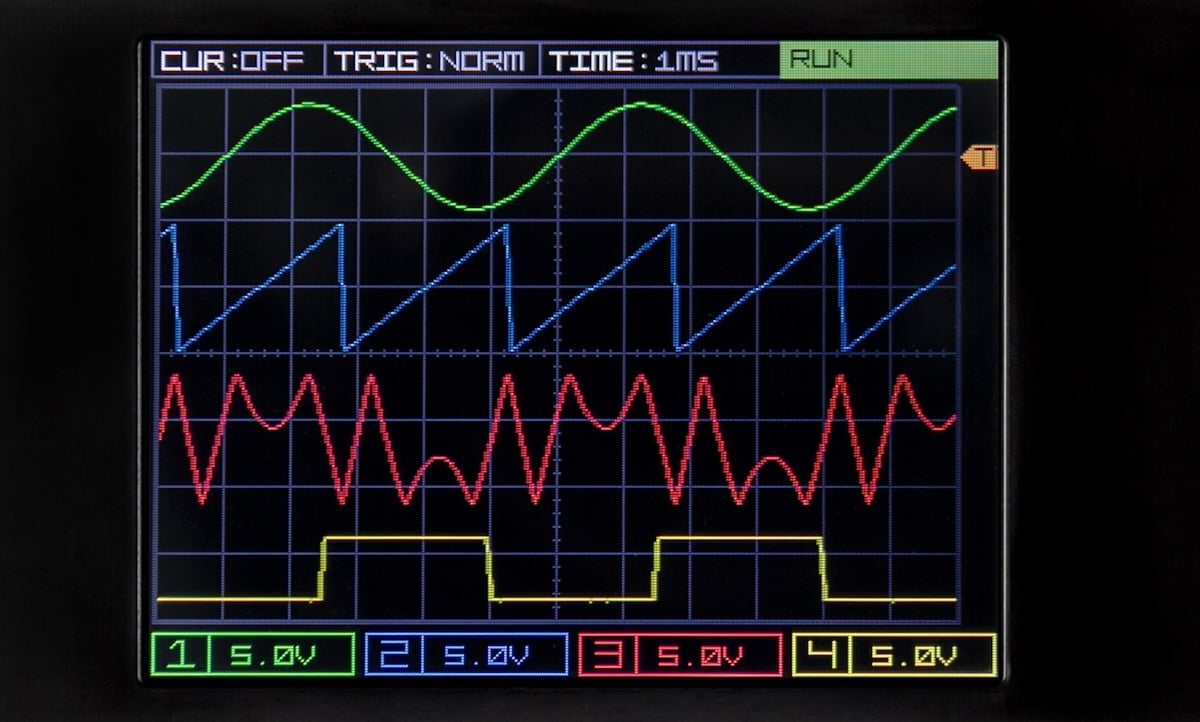
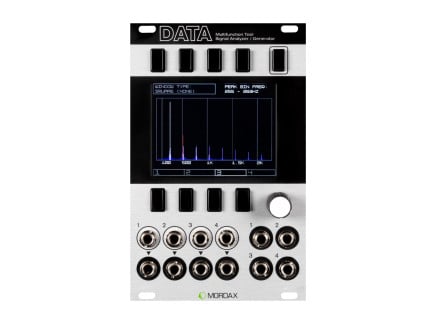
[Above: four-channel oscilloscope display on the Mordax Data Eurorack module.]
Some may question the utility of oscilloscopes when modern digital audio workstations (DAWs) incorporate waveform viewers. Though related, oscilloscopes and DAW waveform viewers serve different purposes. In DAWs, waveforms are often perceived as static entities primarily for editing and mixing, with occasional close-up views. In contrast, oscilloscopes allow for detailed signal analysis, and advanced units can perform mathematical operations on signals.
Setup for oscilloscopes varies based on requirements. In real-time mode, they show live changes, valuable for observing transient spikes or non-repetitive sound changes. Many oscilloscopes also offer a trigger mode, which captures an image based on predetermined conditions, such as synchronizing the display's scan rate based on detecting amplitude thresholds or waveform edges, providing a consistent view of recurring waveforms.
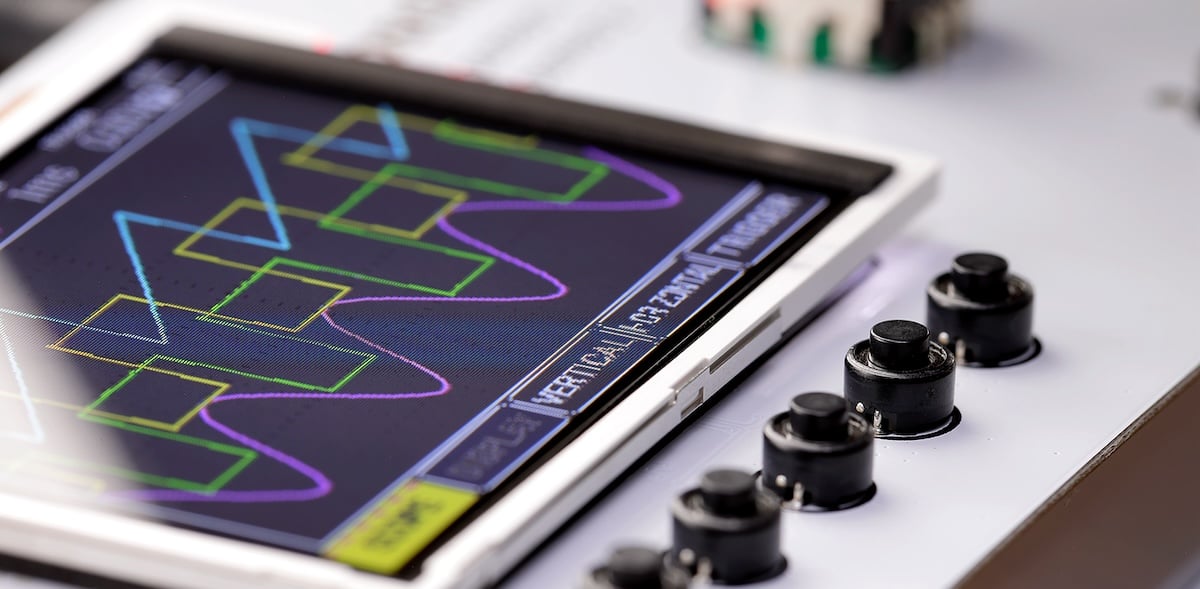
Analyzing an oscilloscope's image reveals various sound attributes. For periodic waveforms, the distance between peaks hints at the sound's frequency. Waveform shapes are descriptive of the timbre, and while exact harmonic content may be difficult to identify from viewing the waveform alone, distinct waveform types (like sine, saw, triangle, or square) can reveal dominant harmonics. Oscilloscopes also depict phase, polarity, and DC offset—attributes not discernible by ear but impactful on sound quality. They excellently visualize effects like distortion, reverb, or modulation, and dual-trace units can demonstrate phase and frequency relationships between two signals—also facilitating "oscilloscope art". Emerging in the 1950s with the innovative work of artist/mathematician Ben F. Laposky, oscilloscope art is one of those quirky creative byproducts of audio analysis tools that I mentioned at the beginning of the article. In essence, an artist produces intricate designs and movements called Lissajous curves on the oscilloscope screen by manipulating audio signals fed into it.

[Above: Lissajous figures created in Max/MSP using two sine waves assigned to X and Y axis movement, one tuned to 1.5x the other's frequency.]
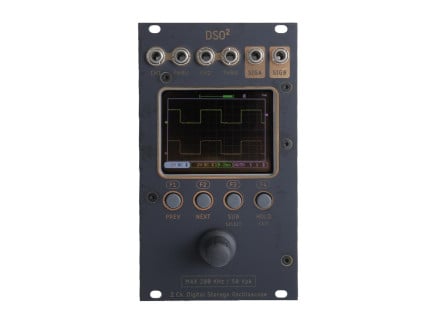
Oscilloscopes have evolved over time. Traditional analog oscilloscopes, now somewhat outdated, display signals on a phosphorescent screen. They excel in real-time waveform display but lack the features of modern digital counterparts. Digital oscilloscopes, including Digital Storage Oscilloscopes (DSOs), Digital Phosphor Oscilloscopes (DPOs), and Mixed Signal Oscilloscopes (MSOs), offer varied capabilities. DSOs, responsive to sharp transients, are popular in audio applications. DPOs merge digital advantages with an analog-style display, ideal for analyzing signal irregularities. MSOs combine DSO features with a logic analyzer, suitable for advanced debugging by displaying analog and digital signals concurrently.
Modern oscilloscopes vary in size and functionality. While some are large tabletop units for professional engineering, others, like the Korg NTS-2, are pocket-sized. Eurorack enthusiasts might recognize modules such as Mordax Data, vpme.de Zeroscope, or Intellijel Designs Zeroscope. These integrate audio analysis into modular synthesizers. Additionally, software-based oscilloscopes for various devices have become prevalent.
Handy Oscilloscopes for Your Modular Synthesizer

 Mordax Data Multifunction Tool 16hpAs low as $395.00Multiple Options Make a selection for stock info
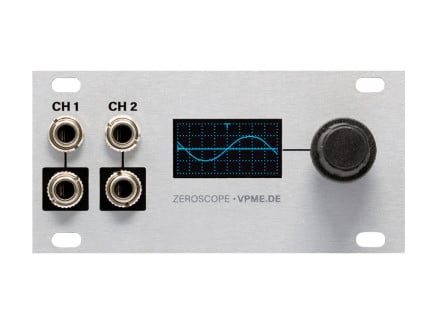 Intellijel Designs Zeroscope Oscilloscope 1U 16hp$139.00Preorder Reserve your order today!
Out of Stock
We're awaiting our next batch of this item. Pre-order to reserve your place in line and we'll fulfill your order as soon as we receive our shipment
Goniometers
Goniometers, sometimes referred to as stereo phase scopes or vectorscopes (although the latter term is more suitable in the context of video analysis), are devices that provide visual feedback about the stereo width and phase relationship of an audio signal. While the images produced by a goniometer are also Lissajous curves, similar to those an oscilloscope makes in XY mode, the two instruments differ in their application and presentation. Oscilloscopes are more general-purpose tools, while goniometers are specialized for analyzing stereo audio signals. In the world of mixing and mastering, goniometers are particularly useful to ensure that the stereo spread of a mix doesn't cause issues, especially when summed to mono.
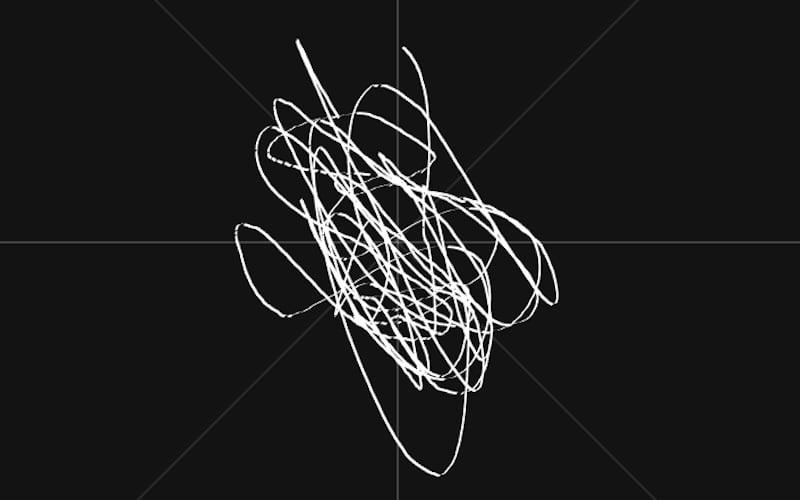
[Above: goniometer readout of a stereo modular synthesizer recording.]
The Lissajous figures displayed by a goniometer act as a graphical representation of the stereo signal, with the left channel being on the vertical axis and the right channel on the horizontal axis. If a signal is completely mono, the goniometer will display a straight vertical line. As the stereo width increases, this line begins to spread outward, forming shapes that give insight into the stereo image. If the shapes stray too far horizontally, it might indicate potential phase issues.
Understanding and correctly interpreting the data from a goniometer is crucial, especially in modern music where the balance between a wide mix and phase coherence is vital. Phase problems can lead to elements of the mix disappearing or becoming less pronounced when the audio is played back on monophonic devices like certain radios or club sound systems. Goniometers help us identify and preemptively address such issues.
Spectrum Analyzers and Spectrograms
Switching to the frequency domain, spectrum analyzers are tools designed to display the frequency content of an audio signal, showing the amplitude of individual frequencies across the audible spectrum. As with an oscilloscope, the vertical axis on a spectrum analyzer represents amplitude. In contrast, the horizontal axis denotes frequency. This representation paints a vivid picture of a sound's frequency range and its overall spectral composition, aiding in understanding its timbral makeup and assisting with tasks like pinpointing problem frequencies, and noise.
Spectrum analyzers have evolved over time. The earliest ones were analog swept-tuned analyzers. They operate on the superheterodyne principle, continuously "sweeping" the frequency of a local oscillator across the desired frequency range and measuring amplitude at each point. The result then gets plotted on a graph. A more recent and popular type of analyzer is the FFT (Fast Fourier Transform) analyzer. It dissects the incoming signal into sections and breaks it down into individual frequency components. FFT analyzers have become the standard, offering more versatility and, in many cases, a more precise representation of a sound's frequency content.
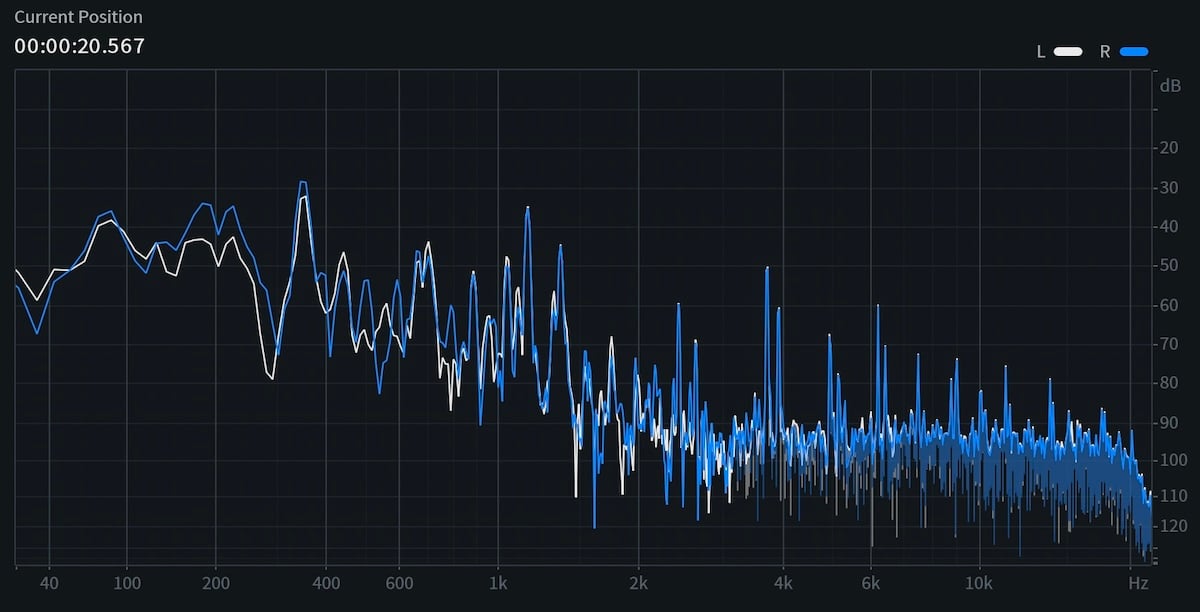
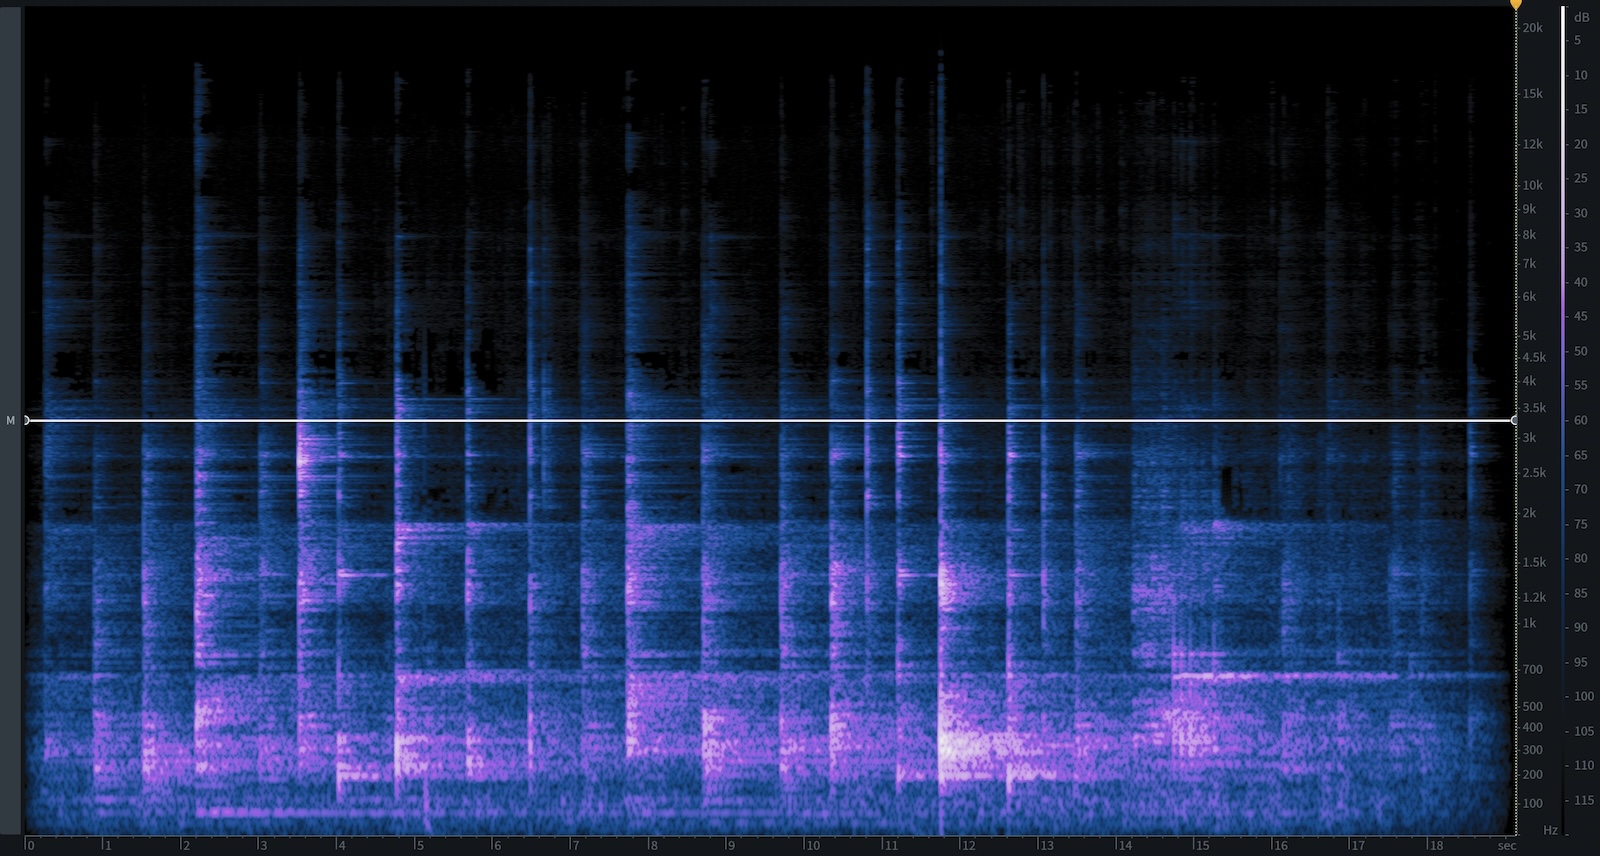
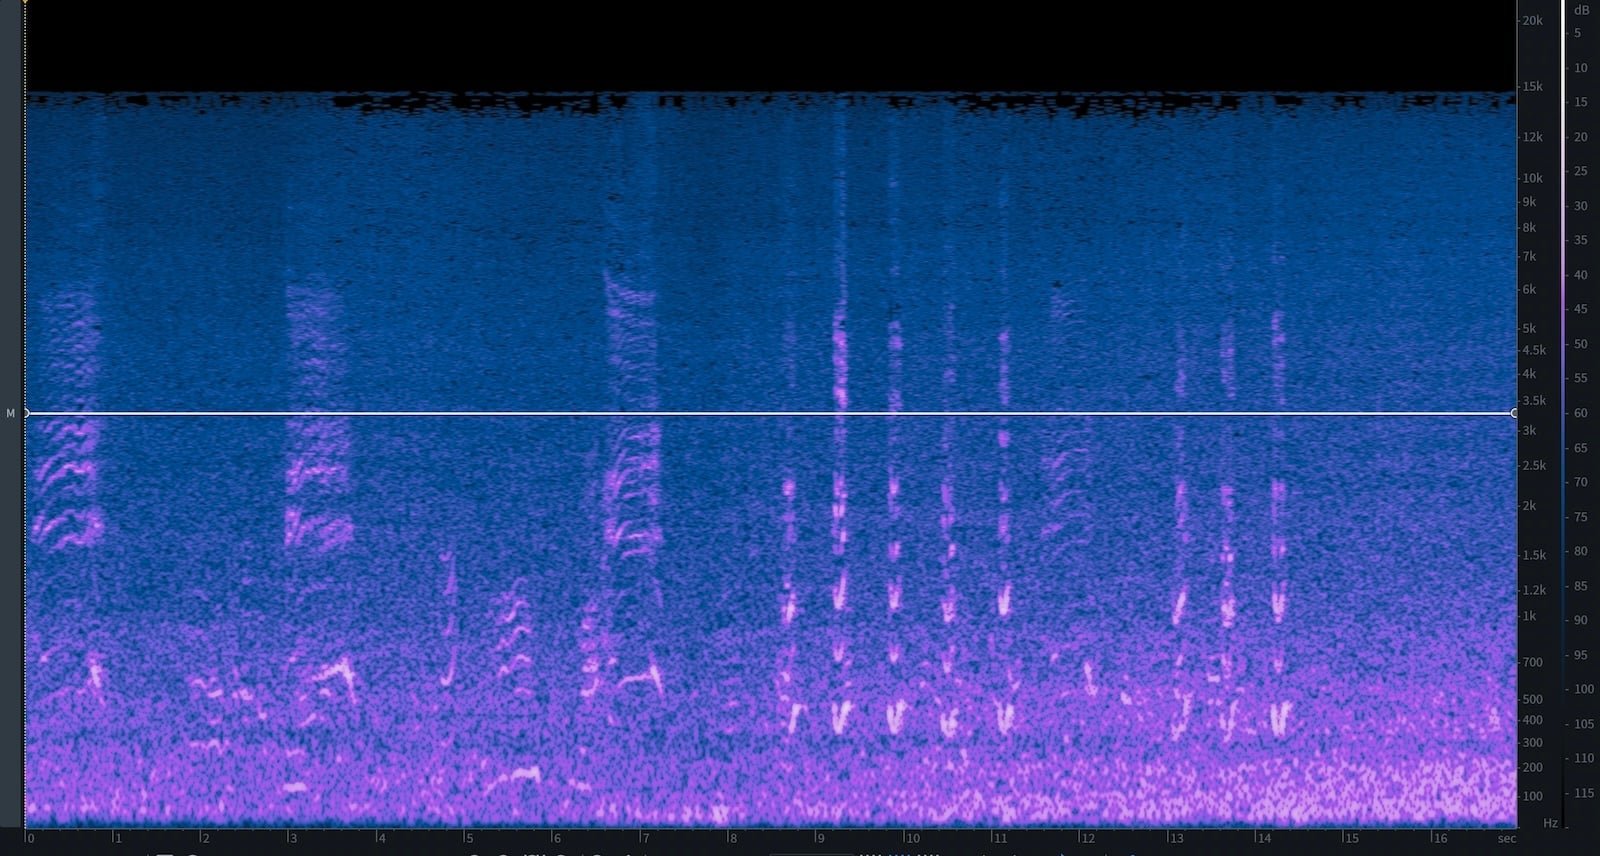
[Above: instantaneous spectral analysis of a modular synthesizer recording.]
For myriad audio applications, a spectrum analyzer proves invaluable. From room acoustics, mixing, mastering, audio production, to composition and sound synthesis—a clear comprehension of the frequency content helps make well-informed decisions. However, another type of analysis tool may offer an even deeper insight into the nature of a given sound—the spectrogram.
A spectrogram, or sonogram, is often likened to the spectrum analyzer's three-dimensional counterpart. It furnishes a time-based representation of an audio signal's frequency content. In simpler terms, while a spectrum analyzer captures a snapshot of frequencies at any given instant, a spectrogram chronicles how those frequencies change over time.
Spectrograms have a unique visual aesthetic. Time is plotted on the horizontal axis, frequency on the vertical, and amplitude is differentiated by color or shade intensity. Brighter patches denote dominant frequencies, while subdued regions signal softer ones. Their detailed view is instrumental in analyzing harmonic content of sounds, pinpointing transient sound events, and tracking sounds with changing spectral content. Spectrograms serve crucial roles in advanced sound design, music analysis, bioacoustics, speech and vocal analysis, and other scientific research fields.
Though various technologies underpin spectrograms, FFT-based instruments dominate due to their efficiency. It is common to encounter spectrograms with adjustable "windowing" functions. The choice hinges on the situation, balancing resolution against spectral leakage (where energy from one frequency spills into adjacent frequency bins). For precision in frequency resolution, the Blackman window is apt, while the Hanning window mitigates spectral leakage. Several other windowing shapes can be explored for optimal results.
In spectrum analysis, the frequency content can be portrayed using either linear or logarithmic (Mel) scales. This influences how frequencies are depicted on the vertical axis and their interpretation. The logarithmic scale often finds favor in general sound and music applications because it mirrors human auditory perception. Conversely, a linear scale is handy for analyzing sounds with closely spaced frequency components or when emphasizing harmonics or specific interferences. Though several spectrogram computations and displays exist, Mel and Linear modes prevail.
Spectrum analyzers and spectrograms exist in both hardware and software formats, and it is not unusual to find a suite of analysis tools bundled in a single device or software with spectral analysis instruments being part of it. For instance, the earlier mentioned Mordax Data module incorporates both a spectral analyzer and a spectrogram. Sonic Visualiser is a comprehensive freeware software suite packed with spectral analysis tools. Another notably popular spectrogram software solution, although not free, is Izotope RX, allowing users not just to monitor but also to modify a sound's spectral data. Although its primary goal is practical—mending sound issues and enhancing or excising particular frequencies or disturbances—spectral editing also serves creative purposes. Years back, Izotope even launched a unique spectrogram-centric software synthesizer called Iris, though it has since been discontinued.
Real-world examples of spectrogram-based art include the work of esteemed electronic musicians like Aphex Twin and Venetian Snares, who have embedded hidden messages in their tracks, molding a sound's spectral content into a purposeful image using software like Metasynth—renowned for its spectral editing and image-based synthesis tools.
Scope it Out
From leveling to stereo imaging, and from frequency analysis to time-based spectral evolution, audio analysis tools are indispensable for a comprehensive understanding and efficient manipulation of sound. As with any tool, the key is in knowing when and how to use them and interpreting their data correctly. Embracing these tools can be extremely beneficial for your sound work, providing clarity and nuance.
So whether you are a novice looking to understand the sounds you are working better or an experienced professional, these tools are immensely helpful wherever you are on your journey through the word of sound. And as technology continues to progress, one can only anticipate even more sophisticated tools on the horizon, further bridging the gap between what we hear and how we understand it.
More Audio Analysis Tools to Scope Out
 ThreeTom Modular Wiretap Eurorack to Oscilloscope Adapter$19.99In Stock Available immediately!